


CANDLESTICKS: SHINING A LIGHT ON STOCKS PRICES
What Are Candlesticks?
Candlesticks are a very common way to chart the price of stocks. They allow you to see the opening price, the highest price in a given time period, the lowest price in that time period, and the closing price value for each time period you wish to display. Although some people prefer using other methods of charting, I like candlesticks because they are an easy-to-decipher picture of the price action. You can easily compare the relationship between the open and close, as well as the high and the low price. Examples of bearish and bullish candlesticks are shown in Figure 1.
In order to create a candlestick chart, you must have a data set that contains (1) opening price, (2) highest price in the chosen time frame, (3) lowest price in that period, and (4) closing price values for each time period you want to display. The time frame can be daily, 1-hour, 5-minute, 1-minute, or any other period you prefer. The hollow (white) or filled (red) portion of the candlestick is called “the body.” The long thin lines above and below the body represent the high/low range and are called “shadows” (also referred to as “wicks” and “tails”). The high is marked by the top of the upper shadow and the low by the bottom of the lower shadow. Two examples follow in Figure 1. If the stock closes higher than its opening price, a hollow candlestick is drawn with the bottom of the body representing the opening price and the top of the body representing the closing price. If the stock closes lower than its opening price, a filled (usually red) candlestick is drawn with the top of the body representing the opening price and the bottom of the body representing the closing price.
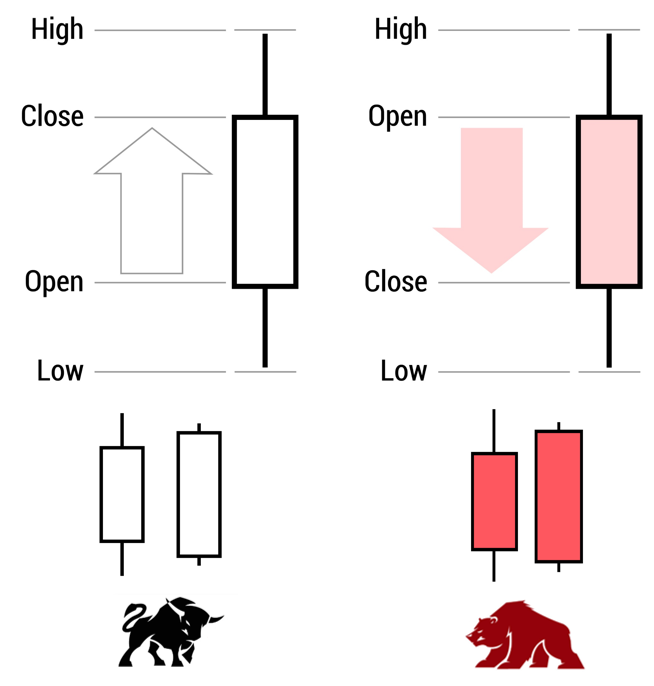
Figure 1 – Candlestick examples.
Besides candlestick charting, there are other styles for representing price action including bars, lines, and point and figure. I personally, however, consider candlestick charts more visually appealing and easier to interpret. Each candlestick provides an easy-to-decipher picture of price action. A trader can immediately compare the relationship between the open and close as well as the high and low. The relationship between the open and close is considered vital information and forms the essence of candlesticks.
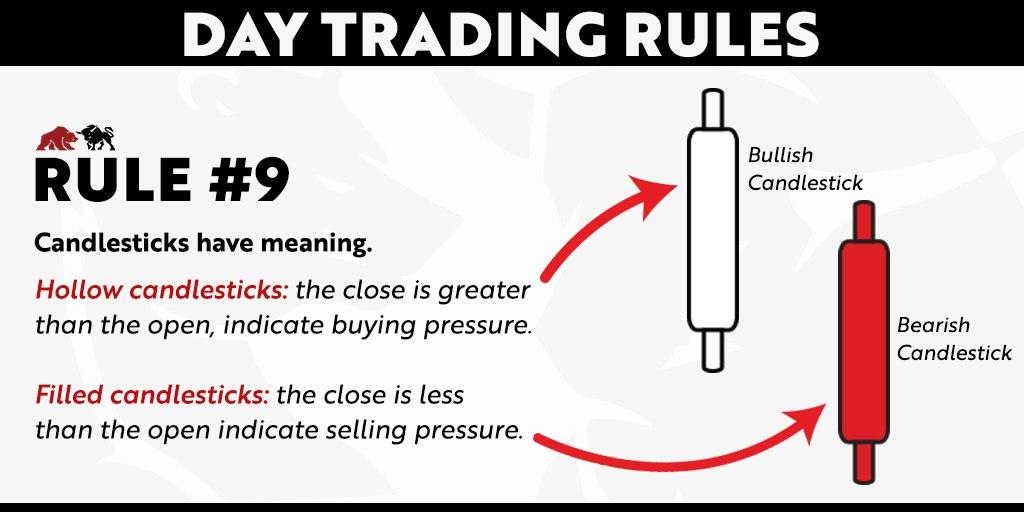
Here is my ninth rule of day trading:
Rule 9: Hollow candlesticks, where the close is greater than the open, indicate buying pressure. Filled candlesticks, where the close is less than the open, indicate selling pressure.
Price Action and Mass Psychology
At every moment in the market, there are three categories of traders: the buyers, the sellers, and the undecided traders. The actual prices of transactions are the result of the actions of all of these traders at a particular point in time.
Buyers are looking for deals and want to spend as little as possible to enter a trade. Conversely, sellers are wanting to sell their shares for as high a price as possible. It’s basic human nature. In some countries and cultures, bargaining and negotiating a price is very common when you are shopping in a store. The person selling the product wants to make as much money as possible, while the person shopping for the product wants to spend as little of their money as possible. In day trading, the difference between the two is called the bid-ask spread. The “ask” is the asking price of the merchant and, of course, the “bid” is the price the shopper offers. In both the marketplace and in day trading, there is a third factor that can also affect prices: the undecided shopper and the undecided trader. The undecided traders are the people staring patiently – and at times not so patiently – at their computer monitors to see which side will prevail.
Undecided traders are the key in pushing the price higher or lower. They’re feared by all of the other traders. Let’s go back to the example of a marketplace in the previous paragraph. You walk into the store, you see a product you want, and you offer a low price for it. You’re the buyer. The seller isn’t all that keen on your suggested price. They offer to sell you the product for a higher price than you suggested. Just as you are deciding what to make as a counter-offer, a tour bus pulls up and a whole crowd of tourists enter the store. You really want that product. Do you buy it at the higher price, or do you take your chances that one of these tourists (the undecided) isn’t going to buy it?
Likewise, let’s pretend you’re the seller for a moment. You know that quite a few stores in this imaginary marketplace are selling the exact same product. You’re a savvy merchant. You open your store thirty minutes before the others open their doors to the public. Do you take your chances that this early morning shopper (the buyer) will buy your product at your price, or will they wait until all of the other stores (the other undecided sellers) open and try to strike a better deal with them for the same product?
In each of these scenarios, the fear of the unknown, the fear of the undecideds, “encourage,” shall we say, buying and selling.
Buyers are buying because they expect that prices will go up. Buying by bulls pushes the market up, or as I like to phrase it, “Buyers are in control.” The result is that buyers are willing to pay higher and higher prices and to bid on top of each other. They are apprehensive that they will end up paying higher prices if they don’t buy now. Undecided traders accelerate price increases by creating a feeling of urgency among the buyers, who then buy quickly and cause prices to go higher.
Sellers are selling because they expect that prices will go down. Selling by bears pushes the market down, or as I like to express it, “Sellers are in control.” The result is that sellers are willing to accept lower and lower prices. They are apprehensive that they may not be able to sell any higher and will end up selling at even lower prices if they miss selling now. Undecided traders make prices decrease faster by creating a sense of urgency among the sellers. They rush to sell and push the prices lower.
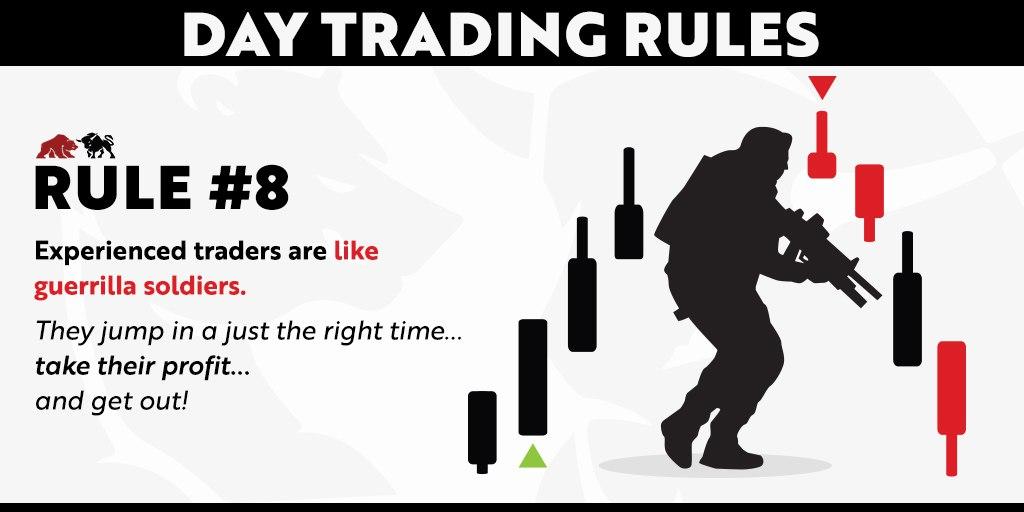
The goal of a successful day trader is to figure out if the sellers will end up in control or if the buyers will end up in control, and then make a calculated move, at the appropriate time, quickly and stealthily. In my book How To Day Trade for a Living, I expound upon guerrilla warfare and guerrilla trading in both Chapter 2 and in my Rule 8.
Rule 8: Experienced traders are like guerrilla soldiers. They jump out at just the right time, take their profit, and get out.
Your job is to analyze the balance of power between the buyers and sellers and bet on the winning group. Fortunately, candlestick charts reflect this fight and mass psychology in action. A successful day trader is a social psychologist with a computer and charting software.
Candlestick patterns tell us a great deal about the general trend of a stock and the power of the buyers or sellers in the market. Candles are always born neutral. After birth, they can grow to become either bearish, bullish or, on rare occasions, neither. When a candle is born, traders do not know what it will become. The bulls and the bears fight it out, and the candle displays who is winning.
Here’s a brief overview of the three most important candlesticks for day trading: bullish, bearish, and indecision strategies.
Bullish Candlesticks
Candles with large bodies toward the upside, shown in Figures 2 and 3 below, are very bullish. It means that the buyers are in control of the price action, and it is likely that they’ll keep pushing the price higher.
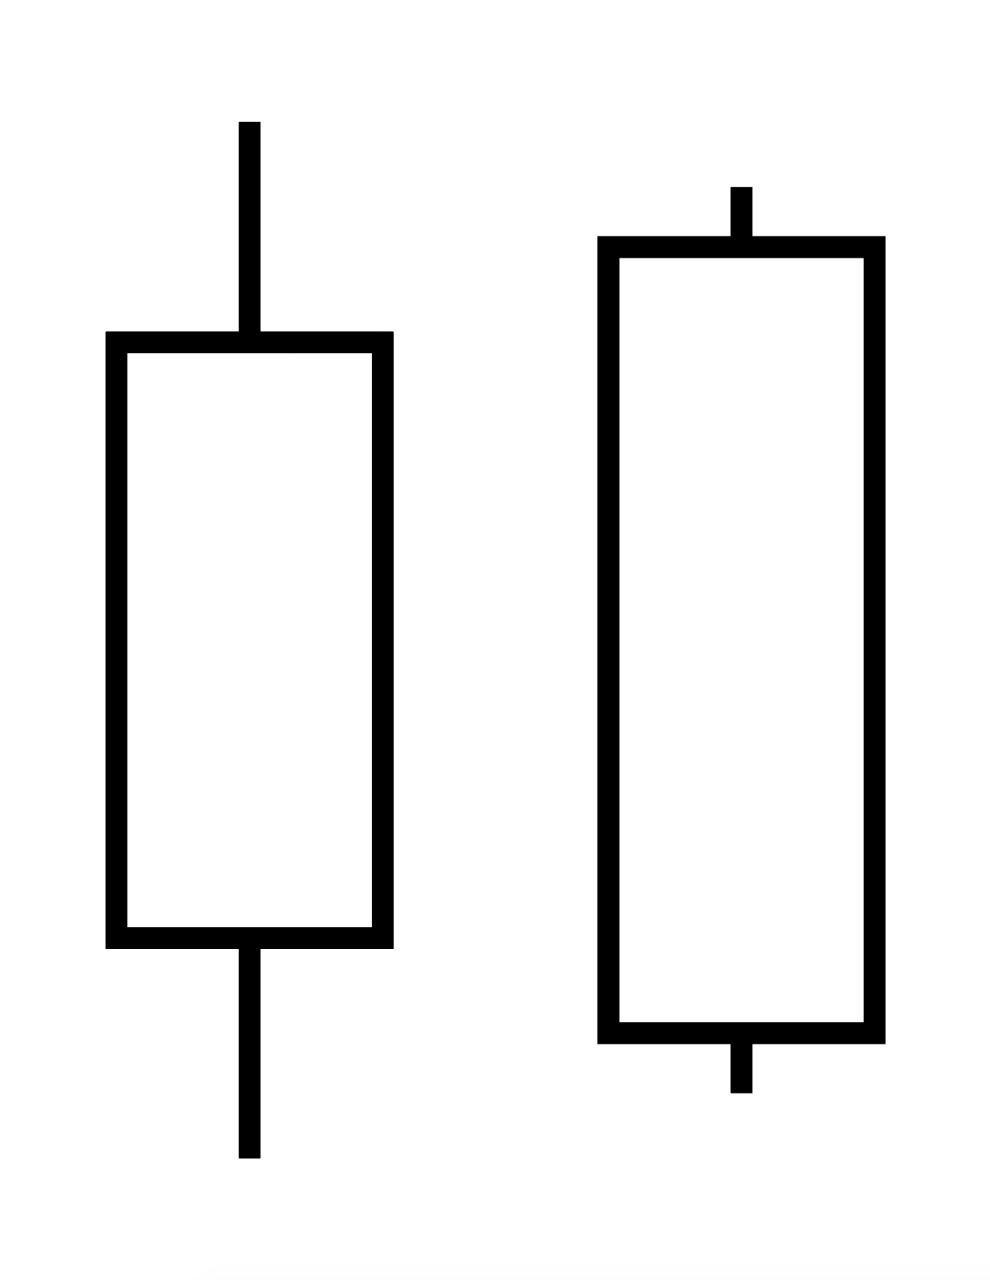
Figure 2 – Bullish candles.
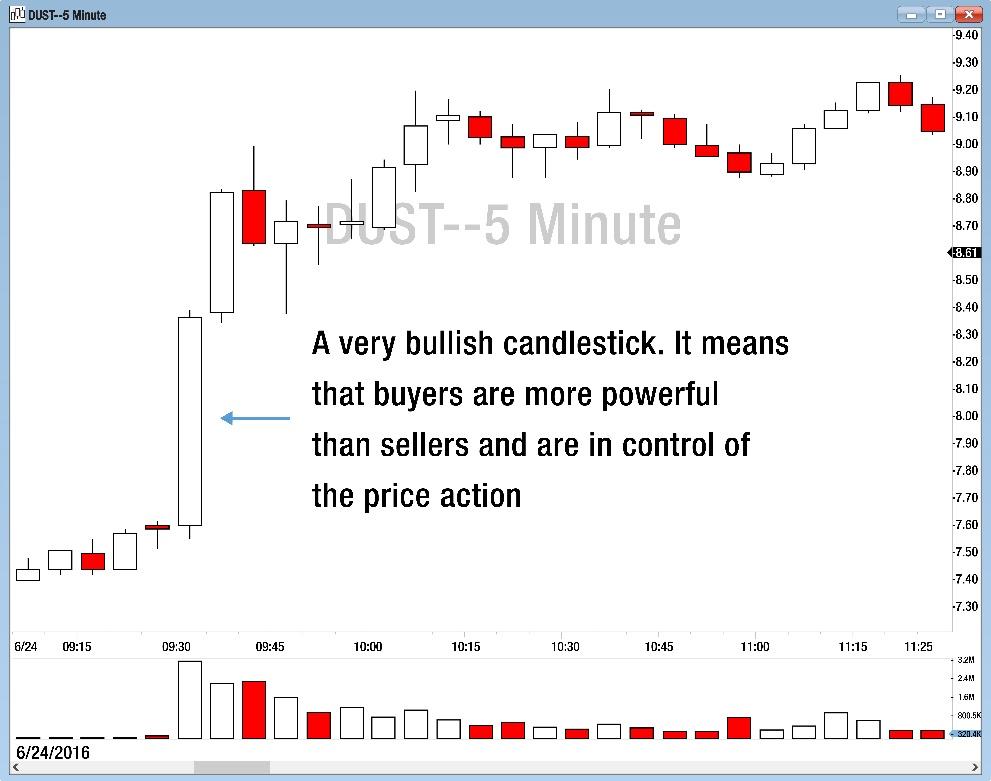
Figure 3 – A series of bullish candles shows that bulls (buyers) are in control of the price.
Bearish Candlesticks
On the other hand, bearish candles are any candles that show a bearish body. A bearish candle tells you that the sellers are in control of the price action in the market and that buying, or a “long” position, would not be a great idea.
Filled candles that have a big filled body, such as in Figures 4 and 5 below, mean that the open was at a high and the close was at a low. This is a good indicator of a bearishness in the market.
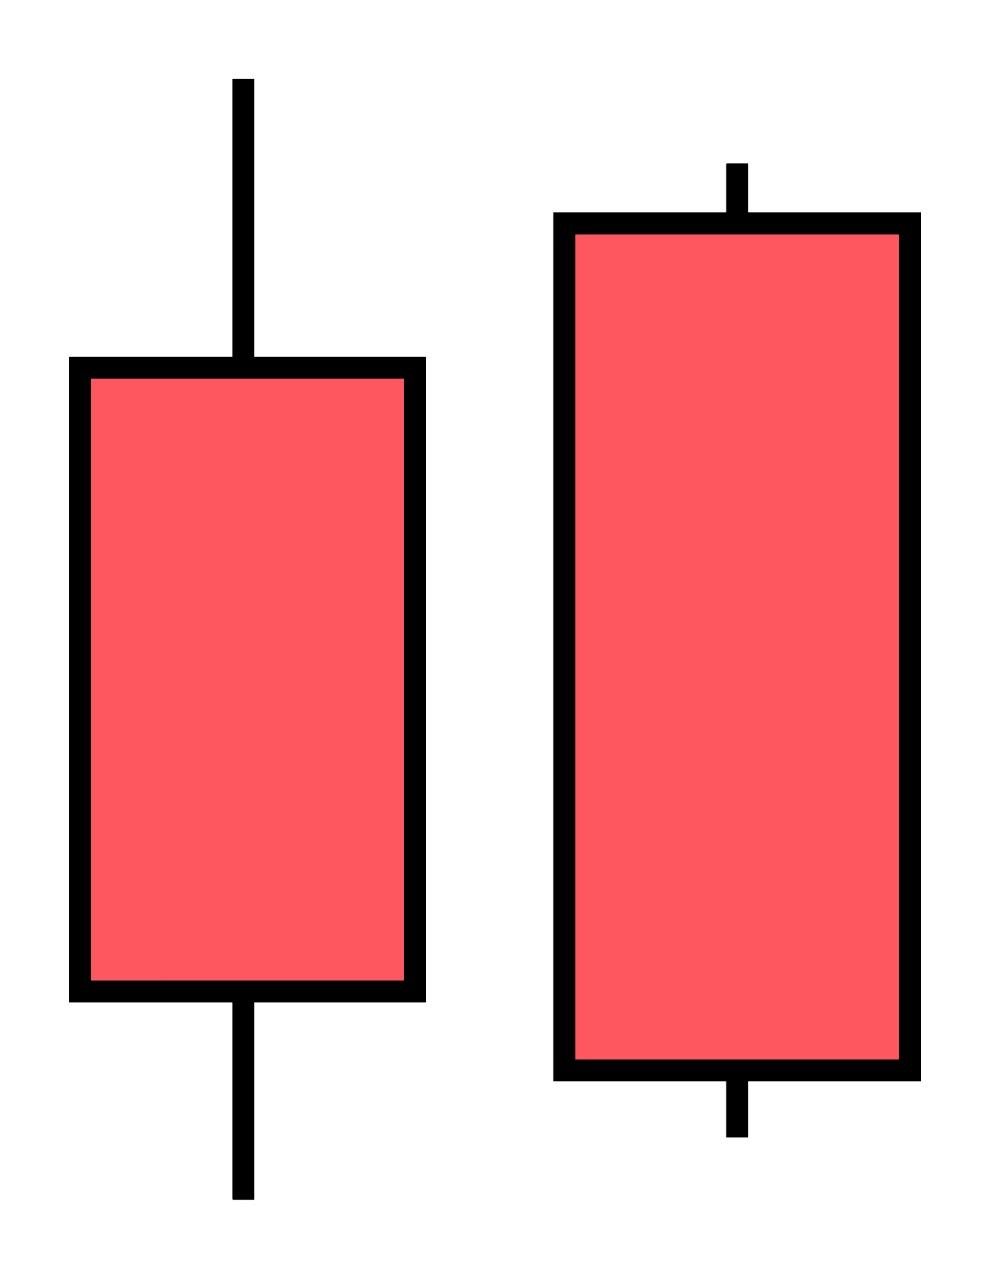
Figure 4 – Bearish candles.
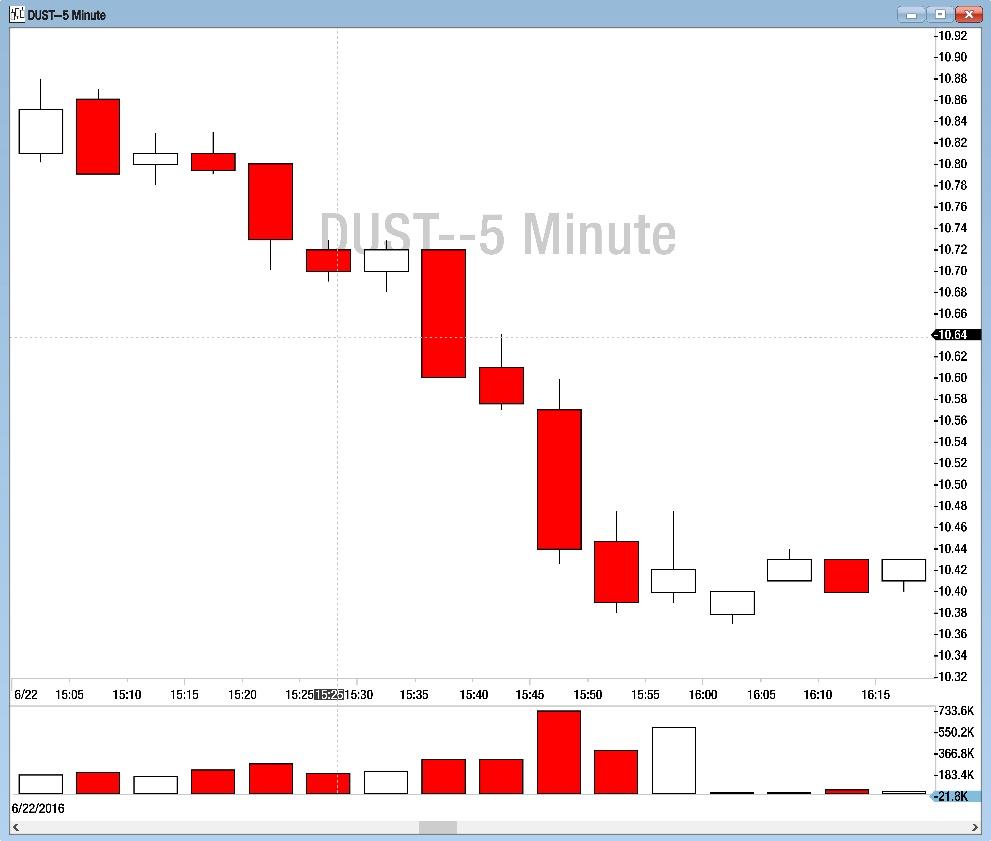
Figure 5 – A series of bearish candles shows that bears (sellers) are in control of the price.
Indecision Candlesticks
The two most important indecision candlesticks for day trading are spinning tops and Dojis.
Spinning Tops
Spinning tops, as seen in Figures 6 and 7 below, are candles that have similarly sized high wicks and low wicks that are usually larger than the body and will often be a little bit more indecisive. Let’s call them indecision candles. In these candlesticks, the powers of the buyers and the sellers are almost equal. Although no one is in control of the price, the fight continues. Usually, the volume is lower in these candlesticks as traders are waiting to see who wins the fight between the sellers and the buyers.
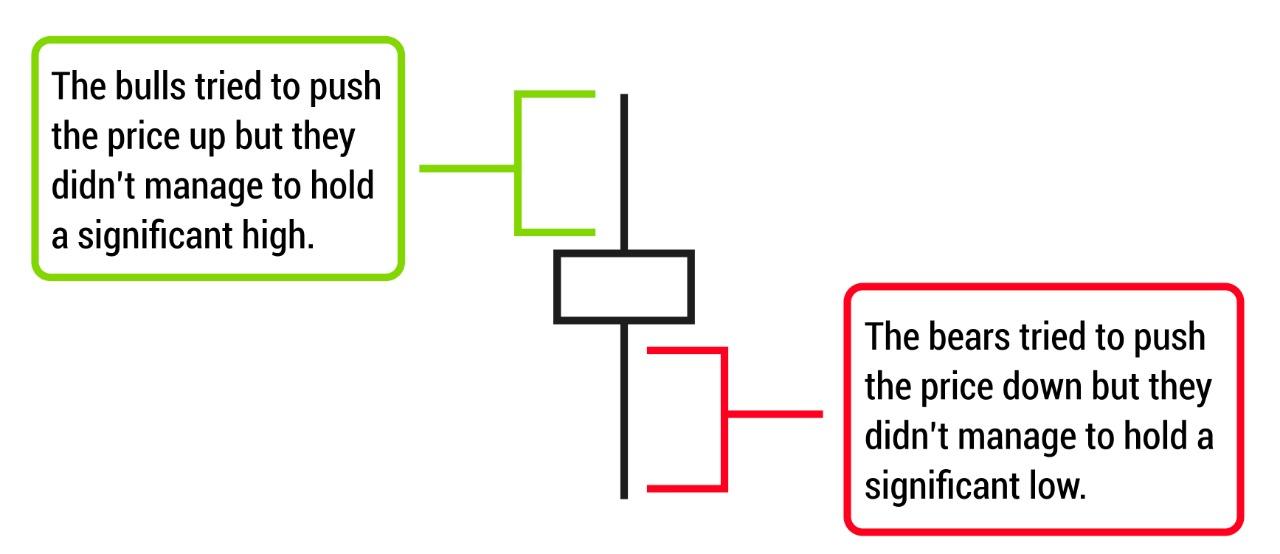
Figure 6 – Buying and selling pressure definition on spinning top candlestick.
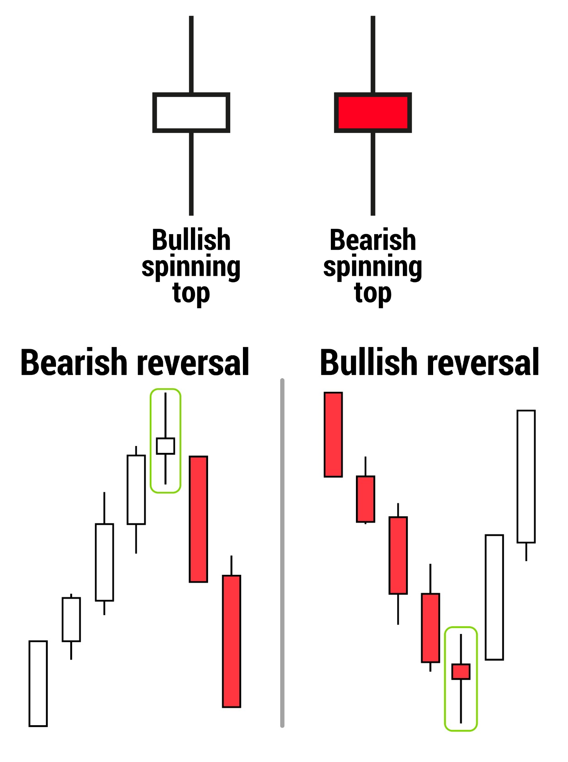
Figure 7 – Formation of spinning top candlesticks for reversal trends.
Dojis: Simple, Shooting Star, Hammer
Dojis are another important candlestick pattern and come in different shapes and forms, but they are all characterized by having either no body or a very small body. A Doji is also an indecision candlestick that is similar to a spinning top. When you see a Doji on your chart, it means there is a strong fight occurring between the bears and the bulls.
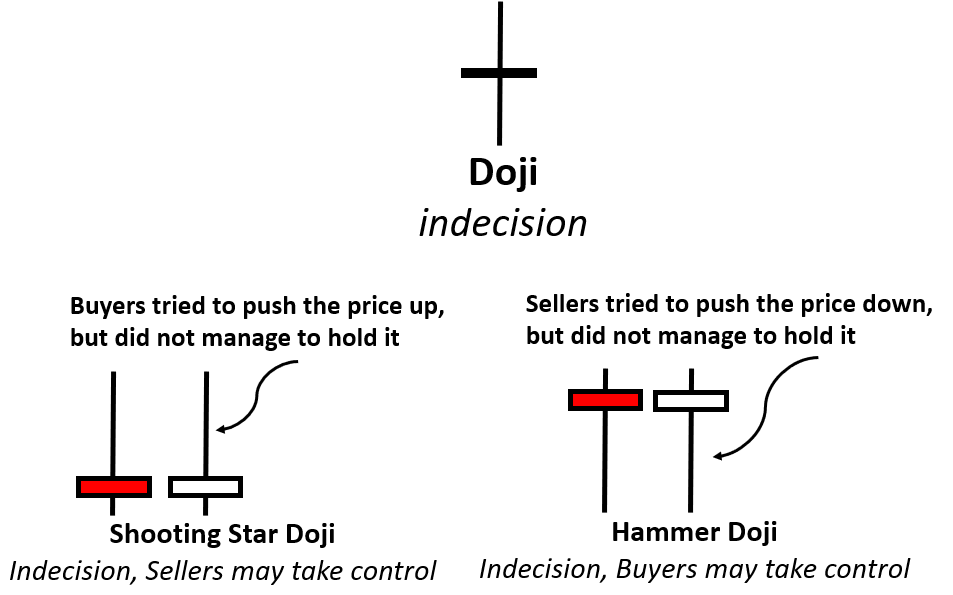
Figure 8 – Examples of Doji candlesticks.
In Figure 8 above, a Doji tells us the same story as a spinning top does. In fact, most types of indecision (reversal) candles tell you basically the same thing.
At times, Dojis will have unequal top and bottom wicks. If the top wick is longer, it means that the buyers tried unsuccessfully to push the price higher. These types of Dojis, such as the shooting star, are still indecision candlesticks, but they may indicate that the buyers are losing power and that the sellers may take over.
If the bottom wick is longer, as in hammer Dojis, it means that the sellers were unsuccessful in trying to push the price lower. This may indicate an impending takeover of price action by the bulls.
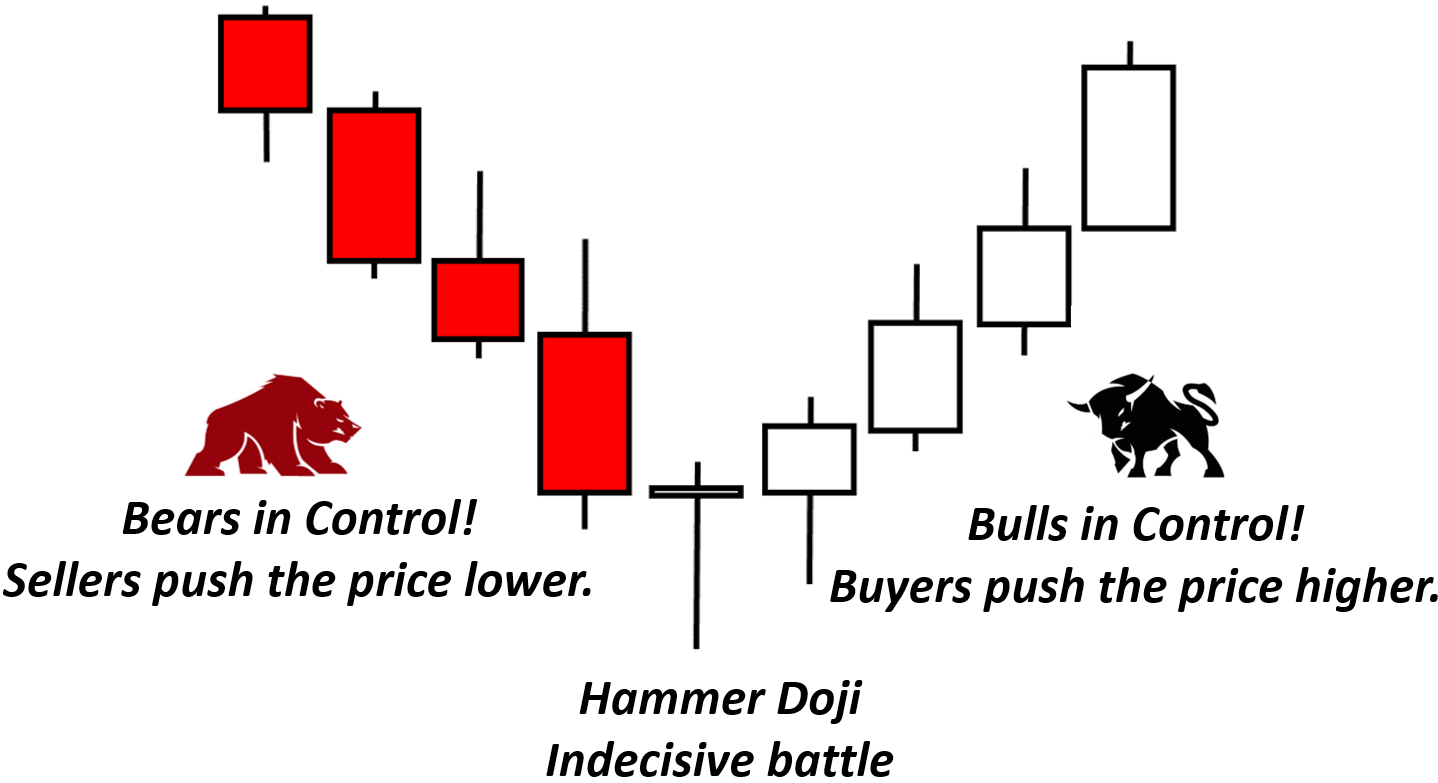
Figure 9 – Bottom Reversal Strategy with an indecision hammer candlestick formed as a sign of entry.
All Dojis indicate indecision and possible reversals if they form in a trend. If a Doji forms in a bullish trend, it suggests that the bulls have become exhausted and the bears are fighting back to take control of the price. Similarly, if a Doji forms in a bearish downward trend, it suggests that the bears have become exhausted and the bulls (buyers) are fighting back to take control of the price. Examples of these in Figures 9 and 10.
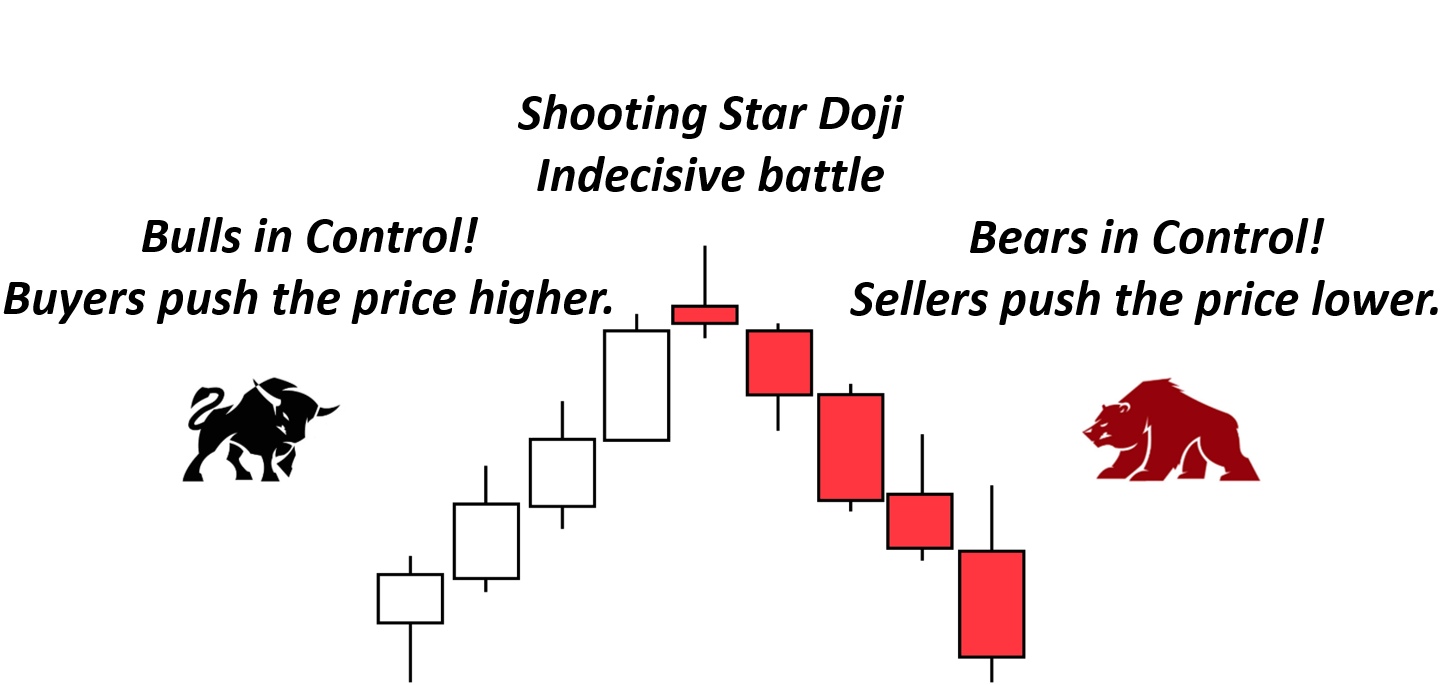
Figure 10 – Top Reversal Strategy with an indecision shooting star candlestick formed as a sign of entry.
After learning to recognize these candlesticks, it is important not to get too excited too quickly. Candles are not perfect. If you take a trade every time you see a Doji formed in a trend, you will end up with significant losses. Always remember that these candles only indicate indecision and not a definite reversal. To use indecision candles effectively, you must look for confirmation candles and ideally use them with other forms of analysis, such as support or resistance levels.
Resources:
- Develop your trading skills with this free real time day trading simulator.
- Check out the most advanced tools for traders and investors: https://tradingterminal.com/
- Learn about one of the best technologies for active trading.
- A Glossary of terms frequently used in day trading.
Would you like to ask Andrew Aziz some questions or share your own experiences? He would enjoy hearing from you at [email protected].